
Inbox placement rate (IPR) is the percentage of your sent emails that actually land in the recipient's primary inbox, as opposed to the spam folder, promotions tab, or being silently filtered. It is the single most honest deliverability metric you have, and it differs sharply from delivery rate. A 98% delivery rate can hide a 40% inbox placement rate, which means more than half your campaign is invisible to prospects.
Short answer: Inbox placement rate is measured by sending test emails to a seed list of monitored mailboxes across Gmail, Outlook, and Yahoo, then counting how many land in the inbox versus spam or other tabs. A healthy cold email IPR sits between 80% and 95%. Below 70% means you have an authentication, reputation, or content problem that will tank your campaign performance regardless of how good your copy is.
What Is Inbox Placement Rate?
Inbox placement rate measures where your accepted emails actually go after the receiving mail server takes them. Once an email is delivered, it can land in the primary inbox, the promotions or updates tab (Gmail), the junk or focused-other folder (Outlook), or the spam folder. Only the first one gets read at meaningful rates.
Inbox placement rate (IPR) is the percentage of delivered emails that reach the recipient's primary inbox, calculated as (emails landing in inbox / total emails accepted by the receiving server) x 100. It excludes hard bounces and rejected mail, focusing only on what happens after the email enters the recipient's mailbox infrastructure. It is the truest measure of cold email effectiveness because emails in spam are functionally equivalent to emails never sent.
The problem is that your email sending platform cannot see inside the recipient's mailbox. Gmail does not tell SendGrid, Lemlist, or any other tool whether your email landed in the inbox or spam. The receiving server says "accepted" either way. This is why most senders fly blind on the metric that matters most.
Inbox Placement Rate vs Delivery Rate
These two metrics get confused constantly, and the confusion costs campaigns. Delivery rate measures whether the receiving mail server accepted your email at all. Inbox placement rate measures where the accepted email ended up.
| Metric | What It Measures | Typical Healthy Range | What It Misses |
|---|---|---|---|
| Delivery rate | % of emails accepted by receiving server (not hard bounced) | 95-99% | Whether email reached the inbox or spam |
| Inbox placement rate | % of accepted emails landing in primary inbox | 80-95% | Whether the email was opened or read |
| Open rate | % of recipients who opened (or whose client loaded the pixel) | 30-50% raw, 15-25% real | Inflated by Apple Mail Privacy Protection |
| Reply rate | % of recipients who replied | 5-15% for cold B2B | Only counts engaged respondents |
A delivery rate of 98% looks great on a dashboard. But if 50% of those accepted emails are going to spam, your real reach is half what the dashboard shows. This is why agencies that obsess over delivery rate and ignore inbox placement keep wondering why their open rates are dropping despite "perfect" sending stats.
Inbox Placement Benchmarks by Industry
What counts as a good inbox placement rate depends heavily on what you send and where. Transactional email and warm marketing email play in different leagues than cold outbound.
Cold email IPR benchmarks from our experience: well-configured cold outbound from warmed secondary domains lands between 80% and 95% inbox placement. SaaS and B2B services sit at the higher end (85-95%). Crowded niches like marketing agencies, lead generation, and crypto frequently sit at 60-80% because the entire category has elevated spam complaint rates. Anything below 60% means something is materially broken: missing authentication, a burned domain, a dirty list, or content that triggers filters.
A few patterns worth knowing:
- Gmail is the strictest mainstream provider for cold mail. Hitting 90%+ IPR at Gmail is hard. Outlook and Yahoo tend to be more permissive for properly authenticated senders, though Outlook's focused-vs-other split adds its own complication.
- Industry matters more than copy. If your domain category (real estate, crypto, gambling, supplements) has a poor aggregate reputation, you start with a handicap regardless of your message.
- New domains start in the 50-70% range even after warm-up. They climb into the 85%+ range over 2-3 months of consistent positive sending behavior.
How to Measure Inbox Placement Rate
Since mailbox providers do not report inbox placement back to senders, you measure it by proxy using seed lists. A seed list is a curated set of monitored mailboxes across major providers (Gmail, Outlook, Yahoo, AOL, ProtonMail, plus regional providers if relevant). You send your campaign (or a representative test send) to the seed list, then check where the emails landed.
The process:
- Build or subscribe to a seed list of 50-100 monitored accounts. Tools like GlockApps, MailReach, MXToolbox Inbox Placement, and Mailgenius maintain large, well-distributed seed lists. Building your own is possible but maintenance heavy.
- Send your test message from the same domain, IP, and sending account configuration you will use for the real campaign. Use the actual subject line and body, not a sanitized test.
- Wait 15-30 minutes for delivery to settle. Some providers re-categorize after initial delivery.
- Read the report: each seed mailbox shows whether your email landed in inbox, promotions, spam, or was blocked entirely. The report aggregates by provider so you can see Gmail at 88%, Outlook at 94%, Yahoo at 76%, etc.
- Investigate specific drops. If Outlook tanks but Gmail is healthy, the cause is usually different from a uniform drop across all providers.
Run seed tests before launching new campaigns and weekly during high-volume sending. A sudden IPR drop is the earliest warning sign of a domain reputation problem, often visible days before open rates noticeably fall.
What Causes Low Inbox Placement Rate?
Inbox placement problems almost always trace back to one of five root causes. Diagnose in this order.
Authentication failures
Missing or misconfigured SPF, DKIM, or DMARC records cause modern mailbox providers to filter aggressively. Since the February 2024 Google and Yahoo bulk sender requirements, this is non-negotiable. Check your records with a tool like MXToolbox or mail-tester.com before assuming the problem is elsewhere.
Domain or IP reputation damage
If your sending domain has accumulated spam complaints, hit spam traps, or sent to too many invalid addresses, providers downgrade your reputation. Recovery takes weeks of clean, low-volume sending. Google Postmaster Tools shows you domain reputation directly if you send enough volume to Gmail.
Volume and pattern anomalies
Sudden spikes in sending volume, sending to a high percentage of new recipients, or burst sending at 3 AM local time all look like compromised account behavior. Mailbox providers respond by routing to spam preemptively.
List hygiene problems
Lists with high invalid-address rates generate hard bounces, which compound into reputation damage. Lists scraped from low-quality sources contain spam traps, which can blacklist a domain on a single hit. Validate every list before sending.
Content triggers
Less impactful than authentication or reputation in 2026, but still real. Heavy HTML, multiple images, shared link tracking domains, all-caps subject lines, and excessive promotional language reduce inbox placement. Plain text or light HTML with one link consistently outperforms heavy templates.
How to Improve Your Inbox Placement Rate
The order of operations matters. Fix authentication first, then reputation, then behavior, then content.
- Lock down authentication. SPF, DKIM with 2048-bit keys, and DMARC starting at p=none then escalating to p=quarantine. Use a custom tracking subdomain instead of the shared one your sending platform provides by default.
- Warm new domains for 4-6 weeks before real outreach. Use a warm-up service with a pool of at least 10,000 real mailboxes. Keep warm-up running in the background even after you start real campaigns.
- Send from secondary domains, never your primary. If a secondary domain gets damaged, you swap it without breaking your business email.
- Keep volume per inbox at 40-50 emails per day maximum. Stack multiple warmed inboxes across 4-6 secondary domains to scale total volume without overloading individual mailboxes.
- Validate every list with a verification service before importing. Expect to remove 10-20% of any list as invalid.
- Honor unsubscribes within 24 hours and make the opt-out obvious. A recipient who unsubscribes is far less costly than one who marks you as spam.
- Use plain text or minimal HTML. One call to action, one link, no images for cold outreach. Save the templated newsletters for opt-in audiences.
- Run weekly seed list tests to catch IPR drops early. Reacting in week one is recoverable; reacting in week six often is not.
If IPR is below 70%: stop sending immediately. Continuing to send from a damaged domain accelerates the damage. Diagnose authentication and reputation, fix the root cause, and rebuild over weeks with warm-up volume only.
If IPR is between 70% and 85%: reduce daily volume by 50%, tighten list hygiene, and run seed tests every 3 days until placement climbs. Continue real outreach at the lower volume rather than stopping completely.
If IPR is above 85%: maintain current behavior, monitor weekly, and resist the temptation to spike volume. Most agencies destroy healthy domains by getting greedy after a successful week.
Monitoring Inbox Placement in ACA
Inside ACA, every connected email account reports its own sending stats and reputation signals. When an inbox starts showing signs of degradation, such as rising bounce rates, falling open rates relative to its baseline, or unusual provider-specific patterns, you can rotate it out of active campaigns and swap in a fresh warmed account without pausing the sequence itself.
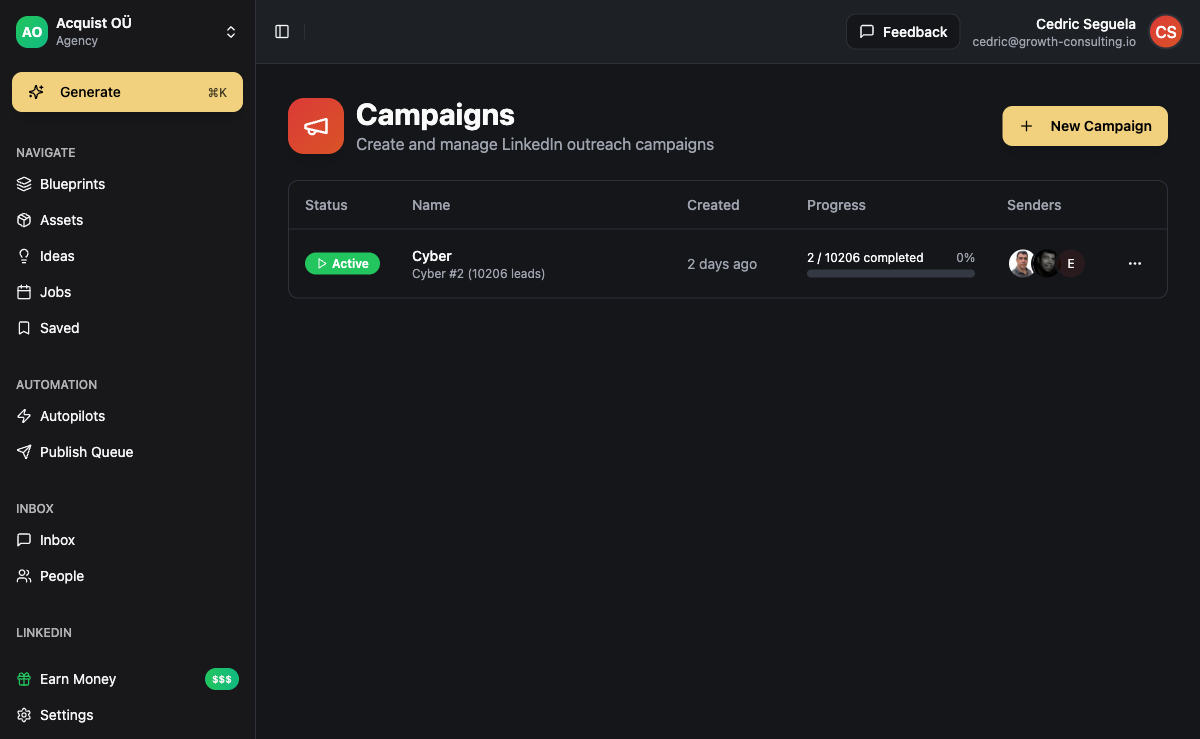
The multi-channel design also gives you a structural advantage on inbox placement. Because sequences can flow through LinkedIn, WhatsApp, Instagram, Telegram, and SMS alongside email, you do not need to hammer the same inbox with 5-7 follow-ups. Fewer emails per prospect means lower complaint rates and healthier sender reputation across the board. Single-channel email senders run out of follow-up budget long before multi-channel senders do.
For agencies running outreach across multiple clients, ACA's workspace isolation ensures one client's deliverability issue stays contained. A reputation problem on Client A's domains cannot bleed into Client B's campaigns. See ACA for AI agencies for how this works at scale.
Frequently Asked Questions
What is a good inbox placement rate for cold email?
For cold B2B outbound from properly warmed secondary domains with full authentication, 80-95% inbox placement is the healthy range. Above 95% is rare for true cold sending and usually indicates a warm list mislabeled as cold. Below 70% means an authentication, reputation, or list quality problem that needs fixing before continuing to send.
How is inbox placement rate different from delivery rate?
Delivery rate measures whether the receiving mail server accepted your email at all (no hard bounce, no rejection). Inbox placement rate measures where the accepted email landed: primary inbox, promotions tab, or spam folder. You can have 99% delivery and 50% inbox placement at the same time, which means half your emails are technically delivered but functionally invisible.
Can I measure inbox placement without third-party tools?
Not reliably. You can build a small personal seed list using your own Gmail, Outlook, and Yahoo accounts to do spot checks, but it will not be statistically meaningful. Tools like GlockApps and MailReach maintain large, well-distributed seed lists and produce reliable IPR measurements. Budget for a paid inbox placement testing tool if cold email is a meaningful revenue channel.
How often should I test my inbox placement?
Before launching any new campaign, after any significant change (new template, new sending account, new domain), and weekly during high-volume sending. Weekly testing during active campaigns is the early-warning system that prevents a slow reputation slide from turning into a hard blacklist event.
Does sending volume affect inbox placement rate?
Yes, directly. Higher per-inbox volume increases the proportion of emails sent to less-engaged recipients, which depresses engagement signals and hurts reputation. Keep individual inboxes to 40-50 cold emails per day. Scale total volume by adding more warmed inboxes across more secondary domains, not by pushing single inboxes harder.
Will using a custom tracking domain improve my IPR?
Almost always yes. Shared tracking domains used by sending platforms can be flagged by providers when other senders abuse them, which damages your inbox placement even if your own sending is clean. Setting up a custom tracking subdomain (a CNAME pointing to your provider's tracking host) typically gives a measurable IPR boost, especially at Gmail and Outlook.